Bringing Research to Retail
LET’S CALL IT A “CONSUMER RECESSION”
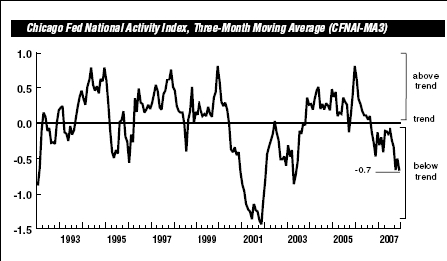
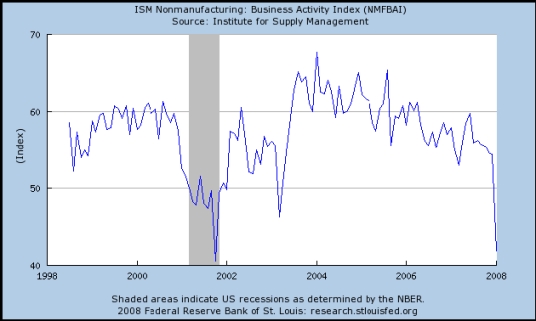
Economists define a recession as two consecutive quarters of negative growth of Gross Domestic Product. Before this officially occurs, it can sure feel like a recession. Like right now. To illustrate, the Chicago Federal Reserve’s National Activity Index fell from -0.29 in November to -0.91 in December (negative values indicate below-average growth, see Chart 1 below). Or, if you like, consider the Institute for Supply Management’s January finding that the U.S. economy contracted sharply, with a reading of 41.9 versus December’s 54.4 (under 50 indicates contraction, see Chart 2 below). We think that Stephen Stanley of RBS Greenwich Capital’s quote, in response to the weak ISM numbers, stated it well: “[the survey results are] downright disastrous. These are recessionary readings.” U.S. fourth quarter GDP increased at an annualized rate of 0.6 percent, following a second and third quarter average gain of 4.4 percent (see Chart 3 below). Our economist friends won’t officially pronounce that the U.S. economy is in a recession for another couple of months. But putting lipstick on a pig does not alter the fact that it is a pig, or a recession.
Chart 1. - Source: Chicago Federal Reserve (CLICK TO ENLARGE)
Chart 2. (CLICK TO ENLARGE)
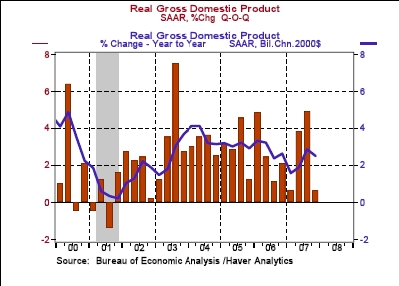
- Chart 3. (CLICK TO ENLARGE)
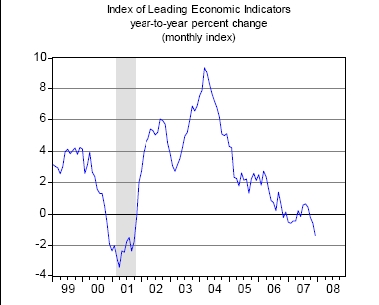
Economists are too much like attorneys (of which the author of this article is). Ask either a direct question, and you are likely to get a very direct answer such as “yes and no,” or perhaps a helpful “maybe.” Consider former Federal Reserve Chairman Alan Greenspan’s recent comments, for example: the odds are “not overwhelming but they are marginally in the direction” of a recession. Or examine current Fed Chairman Ben Bernanke’s statement this Thursday on Capitol Hill; “at present, my baseline outlook involves a period of sluggish growth, followed by a somewhat stronger pace of growth starting later this year as the effects of monetary and fiscal stimulus begin to be felt.” These guys cannot and will not admit that a recession is within the range of their forecast. Come on guys, wake up and smell the Index of Leading Economic Indicators (see Chart 4 below)! We entered a recession in October-November of 2007.
Chart 4. (CLICK TO ENLARGE)
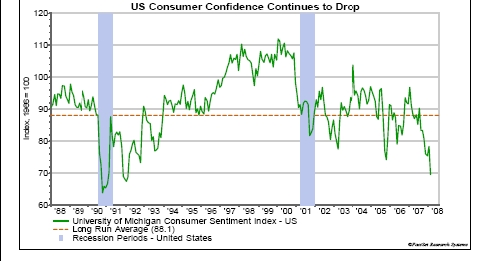
You might now inquire as to how we managed to find our way into this (or, as stated by two other noted economists in 1930 “this is another fine mess you have gotten me into,” MGM Films). Consider that the real estate market is in a free fall. The National Association of Realtors Home Sales Index is down 23.9 percent year-on-year (see Chart 5 below). If you are one of the unfortunates who stretched to buy a home and are now having trouble making payments, this is a very real problem. And so the ripples begin to spread. The banks that made these loans take huge hits, and start to tighten credit among all classes of borrower. For example, according to the January Federal Reserve survey of senior bankloan officers, bankers are tightening lending standards on commercial and industrial loans. The Wall Street investment banks, which hold, bundle and sell these loans, also take hits, which impact their ability to invest in the creation of capital, and the capital markets dry up (if you don’t believe me, take a look at the performance of your IRA or 401(k) during January and February). The insurance companies that back these loans are also in a freefall. The Federal Reserve lowers interest rates to stimulate the economy (see Chart 6 below), and the dollar further weakens, as foreign investors seek higher returns elsewhere, and to diversify their dollar denominated investments. Throw in high energy costs, and consumers get very nervous, and start to curtail spending (the Consumer Confidence Index eroded sharply during the first half of February, the worst since February 1992, and close to the lows hit during the 1990-1991 recession; see Chart 7 below). This, in turn, will cause domestic corporations to scale back capital investments, hiring, and investments in inventory, as their profits are affected. Consider that in December, the Commerce Department announced that 3rd quarter 2007 corporate after tax profits were unchanged, versus a second quarter increase of 5.2 percent. And so it goes.
A daily selection of the top stories for AV integrators, resellers and consultants. Sign up below.
Chart 5. (CLICK TO ENLARGE)
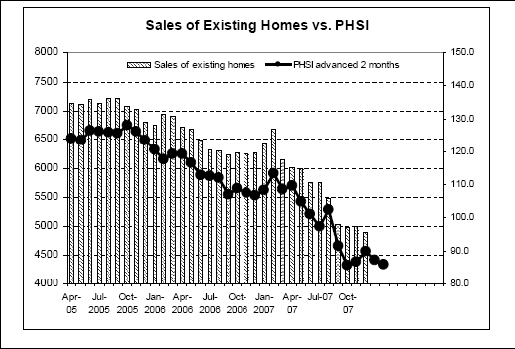
Chart 6. (CLICK TO ENLARGE)
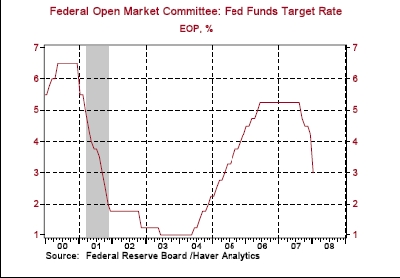
Chart 7. - Source: State Street Global Advisors (CLICK TO ENLARGE)
The next logical question is, of course, how deep and how long? At PRI, we like going out on a limb, because economic forecasting is not our day job, and we can’t get fired if we are wrong. Hey, at least we take a position. In any case, our response is a very straight forward: not very deep and not very long. Here is why to both.
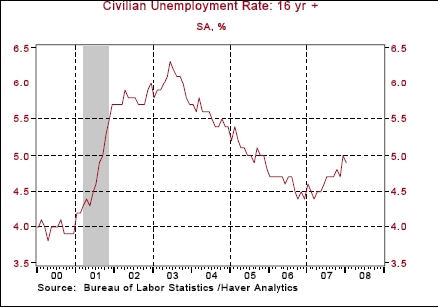
First, the morons in Washington have a huge, inflationary, get-out-the-vote stimulus package in the works (inflation is already starting to creep in, but is not yet a problem; see Chart 8 below). A good short-term shot in the arm and none of these geniuses will be around to pick up the pieces. Second, interest rates are low (the issue, however, for now is not low interest rates, but tight lending standards). Third, while employment is showing weakness (job losses are increasing), employment is, in fact, fairly stable at around 4.9 percent (see Chart 9 below). Other factors, such as low inventory to sales rates are low, meaning manufacturing should stay reasonable stable.
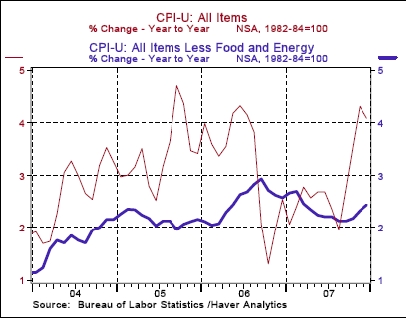
Chart 8. (CLICK TO ENLARGE)
Chart 9. (CLICK TO ENLARGE)
In our view, the current mess we are in is attributable to the fall-out from the crash of the real estate bubble, and the resulting impact on consumer sentiment and spending (or the lack thereof). The real estate mess, like the S&L mess before it, will be addressed. And unlike past deep and long recessions, for the noted reasons, we think that this time will be different. But then again, we are not economists.
RETAIL TRENDS
To a great extent, consumer spending powers the U.S. economy (see Chart 10 below). And this spending drives retail sales. Consider that inflation adjusted spending was flat in December (see Chart 11 below). Spending is, of course, influenced by income (unless you take out a home equity loan or use a credit card). Year-on-year, inflation adjusted personal income rose 2.2 percent in December versus 3.7 percent in December of 2006 (see Chart 12 below). Wednesday’s release of very modest retail sales gains for January indicates that the consumer will continue to remain cautious. These better-than-expected January results were surprising in that most were expecting a train wreck (see Charts 13a, 13b, 13c below). We continue to foresee weakness in retail sales at least through the first half of 2008.
January retail sales rose 0.3 percent, following a drop of 0.4 percent in December. On an annualized basis, retail sales are up 2.7 percent for the trailing 3-months, and are up 3.9 percent for the trailing 12 months. Excluding volatile automobile and gas sales, January retail sales were flat, following a drop of 0.3 percent in December. On an annualized basis, retail sales ex. autos and gas are up 1.4 percent for the trailing 3-months, and are up 2.6 percent for the trailing 12 months.
In this issue of our Retail Analytics report, we wanted to present some of the more arcane and/or interesting measures of the state of the retail economy. Like them or not, they portend weakness in consumer spending and retail sales. Consider the following:
1. The ABC News/ Washington Post Consumer Comfort Index fell this week to its lowest level since November 1993. The index has plummeted 14 points in the past three weeks, only the second time that has happened since the survey began in 1986 (see Chart 14 below).
2. Unity Marketing’s Luxury Consumption Index, as reported in late January, “dropped to historic lows…as more than two-thirds of affluent consumers believe the economy is in trouble.”
3. Starbucks lowered its number of new store openings for 2008 by 27 percent (oh my Latte).
4. The National Retail Federation forecasts modest 2008 retail sales of 3.5 percent.
5. Best Buy cut its earnings forecast, citing a post-holiday slowdown; Sears is cutting 200 headquarter jobs; Talbots is trimming inventories by 7-8 percent this year; Zale is closing 60 stores; Chico’s is cutting capital spending by $100 million; Fortunoff files for bankruptcy; AutoNation’s fourth-quarter earnings fell 31 percent; Charming Shoppes cut 200 jobs and will close 150 unprofitable stores; Movie Gallery plans to close 400 more stores as part of its reorganization; Home Depot will eliminate about 10 percent of its workforce, or about 500 jobs, at its Atlanta headquarters; Wal-Mart will cut prices between 10 to 30 percent on groceries, electronics and other home-related products; Ann Taylor Stores is closing 117 stores over the next two years and cutting 13 percent of its headquarters' staff; etc., etc.
6. November-December holiday sales rose by 3 percent, the smallest since 2002.
7. The Discover U.S. Spending Monitor fell in January, its 3rd straight decline. Nearly half of consumers surveyed expect to spend less on discretionary purchases this month, over 70 percent think the economy is in decline.
8. Credit to fuel consumer spending is moderating. Cash-out mortgages have dried up, and consumer revolving credit, which includes credit cards, rose at an annual rate of 2.7 percent in December, a slowdown from the 13.7 percent jump in November.
9. According to the RBC Cash Index, confidence dropped to 48.5 in early February, from 56.3 in January. This is the worst since the index began in 2002.
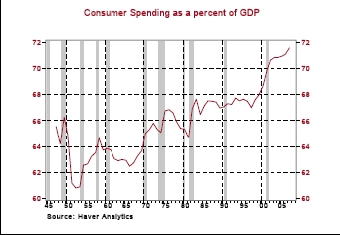
Chart 10. (CLICK TO ENLARGE)
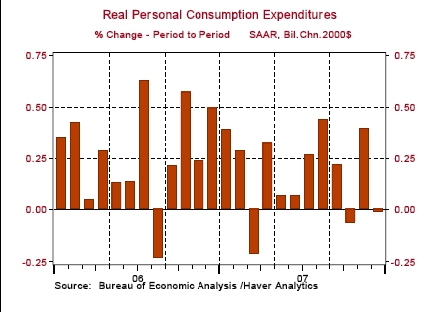
Chart 11. (CLICK TO ENLARGE)
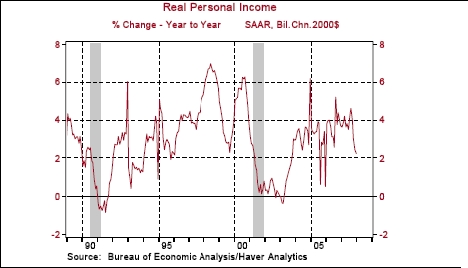
Chart 12. (CLICK TO ENLARGE)
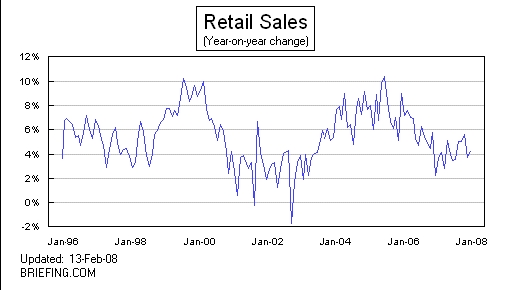
Chart 13a. (CLICK TO ENLARGE)
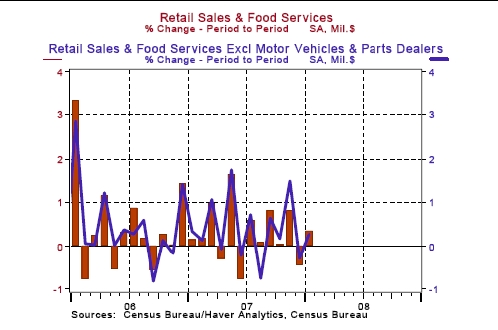
Chart 13b. (CLICK TO ENLARGE)
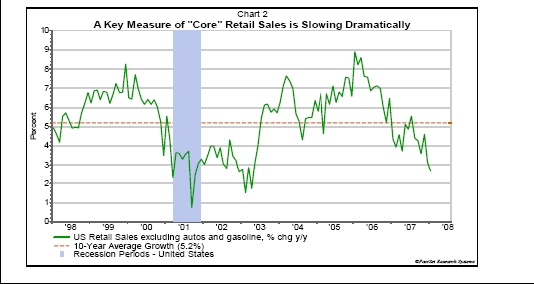
Chart 13c. - Source: State Street Global Advisors (CLICK TO ENLARGE)
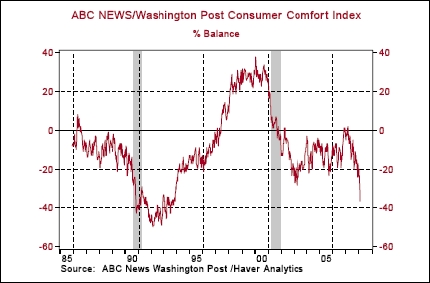
Chart 14. (CLICK TO ENLARGE)
Building Materials, Garden and Supply Stores
Sales fell 1.7 percent in January, following a drop of 2.5 percent in December. On an annualized basis, sales are down 11.1 percent for the trailing 3-months, and are down 4.8 percent for the trailing 12 months.
Food and Beverage Stores
Sales rose 0.3 percent in January, following an increase of 0.5 percent in December. On an annualized basis, sales are up 6.2 percent for the trailing 3-months, and are up 5.3 percent for the trailing 12 months.
Autos
Sales rose 0.6 percent in January, following a drop of 1.1 percent in December. On an annualized basis, sales are down 9.1 percent for the trailing 3-months, and are down 0.2 percent for the trailing 12 months.
Clothing and Accessory (Apparel) Stores
Sales rose 1.4 percent in January, following a drop of 2.3 percent in December. On an annualized basis, sales are up 0.5 percent for the trailing 3-months, and are down 0.1 percent for the trailing 12 months.
General Merchandising Stores
Sales rose 0.1 percent in January, following an increase of 0.2 percent in December. On an annualized basis, sales are up 4.1 percent for the trailing 3-months, and are up 2.4 percent for the trailing 12 months.
Department Stores
Sales fell 1.1 percent in January, following a drop of 0.4 percent in December. On an annualized basis, sales are down 5.1 percent for the trailing 3-months, and are down 4.8 percent for the trailing 12 months.
RESEARCH NOTE
TEST RESULTS FROM A BANK BRANCH DIGITAL
COMMUNICATIONS NETWORK
By Steven Keith Platt, Platt Retail Institute, and Dr. Jean-Charles Chebat, Ecole des Hautes Etudes Commerciales, Canada.
PRI Working Paper No. 6, February 2008
The importance of the customer experience at a bank has been established. This is leading many institutions to evaluate methods to enhance the bank branch environment. Of significance are digital communication networks (“DCN”). Yet such networks can be expensive to deploy and maintain. Therefore, prior to making such an investment, the benefits should be evaluated.
In this Working Paper PRI tested and analyzed the impact on consumer attitudes and behavior resulting from exposure to a DCN. The objective is to provide detailed analytics relating to consumer response to a DCN delivered message stimulus. This was accomplished by gauging impact and awareness, benchmarking the customer bank branch experience, measuring the influence on branch productivity, and track changes in select product/service revenue/transactional activity.
The underlying research is the most detailed ever conducted to measure the consumer response to a digital communication network. The test lasted 90 days and involved ten bank branches; 5 Test, 5 Control. It included two separate waves of exit interviews involving 750 individuals. 38 Digital cameras were installed in the branches, and recorded 17,000 hours of video analyzing the behavior of 85,000 customers. In addition, the test bank provided an extensive amount of primary data.
The significant contributions of this project include the following:
1. Establishes a model for measuring the tangible and intangible attributes of a bank DCN.
2. Methods are advanced to quantify these benefits.
3. In this research, PRI has applied these methods at a test Bank.
4. It was determined that the returns from a DCN investment are substantial.
In summary, the major findings by PRI are presented as follows:
A. DCN Impact and Awareness
Found that the DCN was effective in stimulating consumer message awareness.
B. Customer Bank Experience
Customer satisfaction increased as a result of the DCN. This supports the conclusion that the DCN had a positive effect on the customer experience. Wait-time perceptions, customer satisfaction, customer loyalty, likelihood of recommending the Bank, and the level of service compared with expectation were all positively impacted.
C. Branch Productivity
Branch productivity was positively impacted. The presence of a DCN can increase branch transaction processing, resulting in reducing branch labor costs.
D. Product/Service Awareness and Revenue/Transactional Activity
The following are findings based upon DCN delivered messages:
1. A positive impact on product/service awareness.
2. For 7 of 8 promoted products/services, purchase/usage intent was influenced.
3. For 4 of 8 promoted products/services, customer behavior was impacted.
4. The impact on customer behavior relating to transactional activities was greater than on product/service purchases.
5. When incorporated into an integrated marketing campaign, new customer
product/service sales increased more than current customer account activity.
6. In the majority of cases, the Test branches outperformed the Control branches in revenue generation of non-promoted products.
Copies of this Working Paper can be purchased from the Platt Retail Institute, or secured from its Sponsors pursuant to their license agreement. The Working Paper is 70 pages, contains 67 charts and sells for U.S. $1,000.
IV. SCREEN EXPO EUROPE 2008 SUMMARY
As with the Digital Signage Expo in North America, Screen Expo Europe is a must attend event for players in the digital signage space. Even if your business is confined to North America, you can learn much about the industry by attending this event. We did.
Held 5-6 February 2008 in London, Screen Expo hosted more than 100 exhibitors and over 3,000 attendees (44 percent were from overseas, that is, non-UK). Visitors came from 51 countries. The event is now the largest and best dedicated to digital signage in Europe.
The show featured, among other things, specialist media zones and an interesting Content Gallery showcasing content and network programming from across the European market. What was really unusual about this event was the quality of the educational programming, which was also free (sans the presentation by PRI-sorry).
The educational events ran over four tracks for the two days. Over 50 outstanding speakers presented on a variety of educational topics including the following:
Content for screen media – the time is now.
How does your digital creativity add value to outdoor?
Why content isn’t king if no one’s looking: attracting people on the move.
Rethinking out-of-home: the media owner view.
Plugging into the connected youth
Grow your digital signage business not your overhead.
Waiting in the wings: the German digital signage market.
Proof of delivery – know the audiences you deliver.
Dynamic displays in the public arena.
How to achieve a commercial return from digital advertising networks...some painful lessons from the past...but positive signs for the future.
Windows work wonders: how to turn heads on the high street.
The emergence of the fifth screen.
We strongly suggest attending Screen Expo Europe 2009. The global mix of companies, networking opportunites, and outstanding educational sessions make this well worth the trip (for further information visit: www.screenevents.co.uk).
PRI’s mission is to initiate and secure the funding of studies on specific retail business issues. PRI functions as a conduit, bringing together retail executives with leading researchers. The genesis of the Retail Institute is the recognition of the wealth of knowledge being produced at the University level, on the one hand, and the need for more advanced yet practical business research and insight at the retail level, on the other.
We are grateful to the following members of the Platt Retail Institute for their support.
R.S.P.A. - Retail Solutions Providers Association
Diversified Media Group
Digital Signage Quarterly
Wireless Ronin Technologies
Levelvision
RDM – Real Digital Media
EuropeanRetailAcademy
SCALA Broadcast Multimedia
AccuWeather.com
This report is not to be reproduced or published, in any form or by any means, without the express written permission of the Institute.
Copyright © PLATT RETAIL INSTITUTE 2008. All rights reserved.
Hinsdale, IL
www.plattretailinstitute.org
