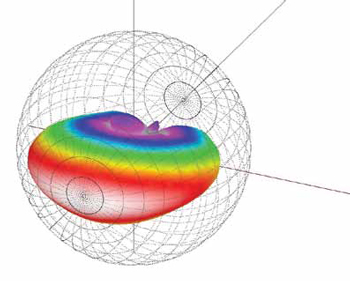
Our social interactions are arranged on a graphic timeline, our weather is beautifully mapped so we know when it will rain, and our brain is explained with full-color MRI images. Our world is filled with beautiful information that, if visualized well, can help us to understand gigabytes of data in one quick look. But these images require care and feeding, and it is all of our jobs to feed this voracious visualization ecosystem.
About a year ago I started experimenting with a form of ambient data gathering. It’s called a Fitbit. It is a hi-tech pedometer that wirelessly sends data to a website for effortless visualization of my daily activities. I didn’t buy it because I’m a fitness fanatic; I bought it because it is a future indicator. At any time I can go to the website or iPhone and get graphic representations of the steps I’ve taken, how rigorous the steps have been (i.e., running or walking) and approximately how many calories I’ve expended. All I have to do is make sure it’s in my pocket and that it gets charged once every couple of weeks (I get a text message when the battery is low). This type of effortless data gathering is inevitable in the future, and it is also essential to the survival of our civilization. That may seem like a grandiose statement, but there are many instances where uncaptured data is, at least, making us inefficient or, at worse, keeping us from living better, longer lives.
“Data” is a very broad topic of discussion. It is ubiquitous; it fuels business and allows doctors to heal. Capturing data can be laborious, but technology can make it effortless, e.g., with the Fitbit or the traffic data that Google gathers as a byproduct of their mobile navigation app. Flowing Data blog creator Nathan Yau wrote about what he refers to as social-data collection in the book Visualizing Complexity: Mapping Patterns of Information. The data cycle is simple: data is collected, analyzed, and then, if a proper interface is created, people can interact with it. Visualizing and interacting with data is ultimately the end goal of data gathering.

In some cases the AV industry has done a decent job of standardizing and making data available for visualizing and interaction. For example, the ubiquity of the EASE acoustical modeling program from ADA has forced most loudspeaker manufacturers to make performance data widely available (you could almost call it open-source data). With this data our industry is visualizing sound system performance every day, all over the world. But would the data have been made available if the visualization tool was not the incentive?
Building Information Modeling (BIM) may be the next catalyst for manufacturers to provide even more data. Another data visualization tool, Autodesk’s Revit, puts this BIM data to use in visualizing spaces for our customers. BIM data will make a wider variety of analysis and visualization possible, including electro-acoustical and visual display modeling.
We are fooling ourselves if we think that keeping data hidden or limiting access is helping our companies or our industry. In the future we will be exchanging only data—no more PDFs, brochures, or paper catalogs. Everything we use (system diagrams, building drawings, spec sheets, websites, price sheets, etc.) will be dynamically created using data in the cloud. View the world from the perspective of what data can be captured today and how it can be used. What is the overlap between BIM data, control system data, EASE data, Customer Relationship Management (CRM) data, and your enterprise resource planning (ERP) data? How will you create systems to capture all of this data so that we can all interact with it and use it to improve the health of our industry in the future?
Paul Chavez (pchavez@harman.com) is the director of systems applications for Harman Pro Group. He is a usability evangelist and a futurologist. Chavez has designed a variety of audiovisual systems ranging from themed attractions to super yachts. He has also taught and written on the topics of interaction design, audiovisual design, and networking.
Innovations in BIM Impacting the AV Professional
Excerpted from the BIM Reference Guide published by InfoComm
The world will see many innovations in the BIM market that will have major impacts upon the AV professional. Here are a few examples:
- * 3D Design: 3D visualizations allow customers to see historic preservation and site context with respect to the new project. They also allow for 3D coordination to reduce RFIs, errors, and omissions.
- * 4D Design (Time): Adds project phasing and construction sequencing to be added to the model. 4D modeling is the integration of a 3D (or BIM) model with a construction schedule in order to visualize the sequence of construction. 4D models can be created to various levels of detail, from high-level zone analysis during the design phase to detailed subcontractor coordination during construction. The same model can be updated and maintained throughout the project based on the updated schedule and 3D model. In a 4D BIM, you would be notified that you cannot schedule installation of tie-lines until after the delayed cable trays have been installed.
- * 5D Design (Cost): Automated Quantity Take-Offs (QTO) and cost estimating, including the relationships between quantities, costs, and locations
- * Collision Detection: Automated ways for examining spatial and sequencing conflicts within a BIM. For instance, imagine automated notification that your speaker now collides with the revamped air ducts.
- * Construction Operations Building Information Exchange (COBIE): COBIE is an information exchange format to capture the information created during design, construction, and commissioning, and allows this information to be passed directly to the building operator. Now the information from the model is passed directly into the owner’s facility management program—without paying again for the same data.
- * Engineering Analysis: Detailed energy modeling and acoustical analysis can be performed utilizing data already in the model.
